
Data Crunching tool provides meter data validation for water utilities
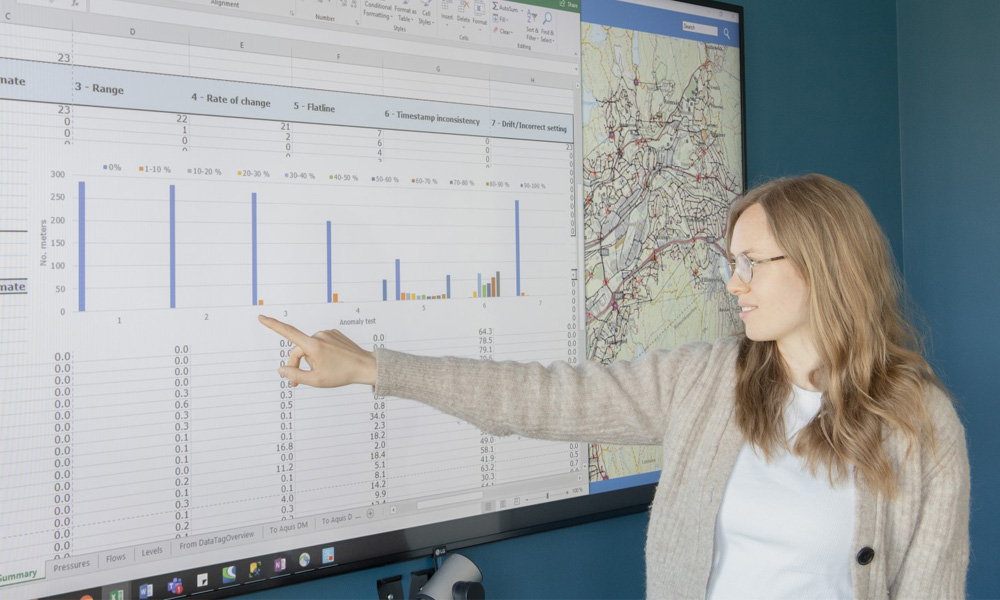
Rosa Marie Mathiasen, engineer at NIRAS, has already been testing the tool on a sample of approximately 100 meters in Malaysia and 800 meters in Oslo.
Experiences from Malaysia and Oslo demonstrate how useful a new online tool, the meter data validation tool, is. The tool determines if deviations in data from water meters indicate an actual water supply issue or if the meter simply needs a calibration.
Measurements spanning twenty-six hours a day, several different values with the same time stamp and right out flatlines are some of the dubious measurements which indicate that a water meter should be calibrated or replaced.


From Jonas Kirstein’s PhD thesis – read it here.
Jonas Kirstein, PhD from DTU in collaboration with NIRAS, devoted a large part of his study to analyse the most common mistakes found in the data from meters installed throughout water distribution networks. During his research, based on 32 months of monitoring data of three Danish utilities, Jonas discovered that up to 35% of the meter data is dubious.
Data testing and validation
Many utilities depend on the collected data from water distribution networks, among other things, to detect leakages, to run hydraulic model simulations or to apply machine learning approaches on the collected data. However, all these approaches depend on data that represents the actual state of the network and not on data that contains too many erroneous measurements.
If the data input is erroneous, the results of data-dependent applications may lead to wrong conclusions. Thus, to avoid misinterpretation of data, Jonas has developed a tool, the meter data testing tool, that identifies when dubious measurements are received from a meter. The tool only takes a few seconds to analyse most of the data for any individual meter. This means, that utilities can react quickly to actual water loss issues and dispose their resources tactically in case of a meter error.
It is not much of a stretch to imagine how valuable this tool can be in detecting problems in the meters, especially in countries where meter data is less reliable than the Danish data.
In the field
The tool has already been tested on a sample of approximately 100 meters in Malaysia and 800 meters in Oslo. Data validation of the 100 Malaysian meters showed that many meters were sending poor data, or no data at all.
“It turned out that many meters were not properly installed, causing the meters to report erroneous data,” says Rosa Marie Mathiasen, engineer at NIRAS, Denmark, and responsible for testing the tool.
The tool has been used as a part of a model calibration:
“100 meters are considered a small batch taking the model area into consideration,” Rosa says, “but that only amplifies the need for correct data, since this is the only data we can collect in this area.”
Due to the results of the meter data validation tool, the Malaysian utility company is currently working on resetting the meters that were not installed properly.
Currently, Rosa is analysing the results of the 800 Oslo meters. She can run the analysis on her computer anywhere in the world:
“The tool is online, so I can just set my computer to start analysing. The advantage of the tool is that we can provide an overview of the meter errors to the utility company, which makes it easier for them to prioritise which meters to look into first, something that can be challenging otherwise,” says Rosa. She looks forward to using the tool again, once the meters are calibrated: “It will be exciting to see how the new data compares to the first measurements.”
Great potential
The meter data validator has great potential, Klavs Høgh, Project Director at NIRAS, says. He has been closely involved in developing the tool as one of the supervisors during Jonas’ PhD.
“We see that utilities are becoming more and more data-driven. For example, advanced applications for improved water loss control rely heavily on the collected data. It is therefore very valuable to use accurate data, so that decisions are based on realistic scenarios and not faulty data.”
Even though the tool shows individual meter data, it is possible to compare data from all meters in a geographical area. This means that temporary anomalies can be corrected based on the data from the surrounding meters.
Klavs elaborates: “If a meter suddenly stops sending data, but the surrounding meters keep sending, this probably means that something blocks the signal, like a parked car.” In this case the utility company won’t waste resources sending an employee to the spot. Only if the meter remains flat for a longer period than feasible, utilities should act.
Besides improving the data on which strategical decision are made by utility companies, the tool also reduces costs for monitoring and maintaining the network.
“We are moving towards smart water solutions, where all individual measurements are part of a bigger network. This means that utilities in the future can swap their calendar driven maintenance schemes with data driven schemes, where they can repair if the actual need is there, not because the calendar says so.”
The tool is now accessible online for all utilities and those with access to meter data to test. Please contact Jonas Kirstein (JKI@NIRAS.DK) if you have questions regarding the meter data validation tool.
